Predicting Outcomes of a Contested Hormuz Transit Using Stochastic COFM Simulation

Abstract: To quantify the probability of a successful People's Liberation Army Navy (PLAN) escort mission through a heavily contested Strait of Hormuz, opposed by a dual-layered blockade enforced by United States Naval Central Command (NAVCENT), a stochastic Correlation of Forces and Means model is applied. The model integrates a 15% epistemic intelligence uncertainty variance alongside randomized variables for electromagnetic spectrum degradation and geographic force multipliers. Given a localized operational threshold of 1.1 (requiring a 10% combat overmatch for the escorting force to achieve localized dominance), the simulation yields an 76.04% probability of PLAN mission success. The simulation demonstrates that in highly constricted littorals, the operational environment acts as the primary governor of combat potential, effectively neutralizing theoretical platform superiority. Ultimately, the geographic dispersion of US forces severely limits their available salvo mass. NAVCENT currently lacks the necessary combat density to overcome the localized mass generated by a combined PLAN/Iranian defense, mathematically precluding a successful blockade without unacceptable Blue Force attrition.
Introduction
The Strait of Hormuz has long operated as the central nervous system of global energy supply chains, but recent geopolitical shifts have transformed it into a primary theater for great power competition. The contemporary situation is uniquely volatile. The Trump administration's implementation of a naval blockade posture in the region—aimed at severing Iranian hydrocarbon exports and curbing Tehran's regional influence—has created a strategic crisis for Beijing.
China is heavily dependent on Middle Eastern energy imports to sustain its industrial base. For the Chinese Communist Party, "Freedom of Navigation" is no longer a Western diplomatic talking point; it is a vital national security imperative. To secure its Sea Lines of Communication (SLOCs), the PLAN has increasingly leaned into its doctrine of Yuan Hai Hu Wei (Far Seas Protection). When diplomatic signaling fails and Beijing determines that a tanker convoy must pierce the US blockade, the Strait ceases to be a localized contested area and becomes a multi-domain kill box.
Public defense discourse surrounding a potential US-China clash in the Middle East is routinely polluted by cognitive warfare. Western narratives often take for granted that qualitative dominance in platform engineering and carrier aviation guarantees sea control. Conversely, adversarial propaganda insists that asymmetric missile saturation renders US surface fleets entirely obsolete. Both perspectives are deterministic fallacies that ignore the chaotic friction of war.
To evaluate this scenario accurately, defense planners must rely on rigorous operations research. This paper strips away geopolitical rhetoric to examine a specific, highly volatile order of battle: a high-end PLAN Surface Action Group (SAG) attempting to force a convoy through a US blockade, supported by Iranian shore-based assets. By applying a stochastic simulation engine to this scenario, we can map the probability of success and identify the critical variables that dictate victory or defeat in the littorals.
Methodology: The Stochastic COFM Framework
The foundational mathematics of this analysis rest upon the Correlation of Forces and Means (COFM). Long utilized by Soviet and Chinese operations analysts, COFM calculates the operational potential of opposing forces. In its baseline, deterministic form, the equation is expressed as:
$$Q = \frac{\sum (W_i \cdot K_i \cdot M_i)_{Red}}{\sum (W_j \cdot K_j \cdot M_j)_{Blue}}$$
Where $W$ is the quantity of a weapon system, $K$ is its qualitative coefficient (normalized against a baseline standard), and $M$ represents environmental or positional multipliers.
Deterministic COFM models however, assume a sterile battlefield. To accurately reflect modern naval combat—where electronic attack, weather conditions, and system failures dictate outcomes—this study transitions the static equation into a stochastic model. By running 10,000 independent Monte Carlo iterations, the engine maps a probability density rather than a single binary outcome.
Defining the Friction Variables
To model combat chaos, two specific ranges of variance were introduced:
- The Environmental Multiplier ($M$): $M$ is defined as a randomized bounding box. For the Blue Force (US), this multiplier fluctuates to represent the success or failure of their kill-web networking, sensor degradation due to coastal clutter, electronic warfare (EW) and geographic penalties. For the Red Force (PLAN/Iran), $M$ fluctuates based on the efficacy of the integration of ISR-targeting pipelines and the effects of US EW.
- Epistemic Uncertainty ($k\_variance$): We lack perfect intelligence regarding the true combat effectiveness of both US and Chinese systems in peer-to-peer combat. To account for this, a 15% randomized variance was applied to all baseline weapon qualities ($K$) in every single iteration. A system with a baseline quality of 1.0 could perform anywhere from 0.85 to 1.15 in any given loop, representing hardware malfunctions, software glitches, or unexpected combat over-performance.
Order of Battle and Scenario Parameters
The scenario parameters reflect a dual-layered US blockade. NAVCENT maintains 6 Arleigh Burke-class destroyers in theater, geographically separated: 2 operating inside the Persian Gulf, and 4 operating in the Gulf of Oman screening a Carrier Strike Group (CSG).
The Victory Threshold
In military science, operational parity (a COFM ratio of 1.0) inherently favors the defending force. Because the PLAN is the operational attacker, they require a localized overmatch. For this simulation, the operational success threshold was set at 1.1. If the Red Force achieves a calculated combat power 10% greater than the Blue Force, it is logged as a successful transit where the blockade is broken.
Force Red: The Escort Alliance (PLAN / Iran)
The Red Force is optimized for High-Value Unit (HVU) escort and area denial.
- Command and Control: 2x Type 055 Destroyers ($K = 1.0$). These serve as the baseline and reflect their dual-band AESA radars, 112-cell VLS magazines and YJ-21 hypersonic missiles.
- The Defensive Screen: 4x Type 052D Destroyers ($K = 0.8$) and 2x Type 054B Frigates ($K = 0.65$), which serve as an air defense screening and anti-submarine warfare (ASW) force respectively.
- Sub-Surface: 1x Type 093B SSN ($K = 0.85$).
- The Force Multiplier: 1x Iranian Integrated Coastal A2/AD Battery ($K = 0.7$). While qualitatively inferior to naval platforms individually, this represents an aggregated, highly survivable network of coastal cruise missiles and drones.
- Red Stochastic Range: Capitalizing on the proximity of the Iranian coastline, Red's Environmental Multiplier ($M$) is bounded between 0.8 (assuming highly effective US jamming) and 1.6 (assuming optimal sensor, weapon and command integration between Iranian shore based assets and PLAN SAG, allowing for long-range precision strikes with hypersonic missiles).
Force Blue: US Naval Central Command
The Blue Force represents a highly lethal but geographically compromised posture.
- Surface Combatants: 2x Arleigh Burke DDGs in the Persian Gulf ($K = 0.9$) and 4x Arleigh Burke DDGs in the Gulf of Oman ($K = 0.9$).
- Aviation: 1x Carrier Strike Group Air Wing ($K = 1.0$).
- Sub-Surface: 1x Virginia-class SSN ($K = 1.1$), modeled above the baseline due to its acoustic stealth in littoral waters.
- Blue Stochastic Range: It is vital to note how the COFM model handles the geographic split of the Arleigh Burkes. While an attrition model (like Hughes) would penalize this split as isolated salvo exchanges, the COFM model penalizes it via the $M$ variable. Because the Omani peninsula physically divides the 2 Gulf DDGs from the 4 Oman DDGs, cooperative engagement capability and overlapping radar coverage are severely degraded. Consequently, Blue's multiplier ranges from a depressed minimum of 0.6 to a maximum of 1.2.
Results: The Mathematical Reality of the Engagement
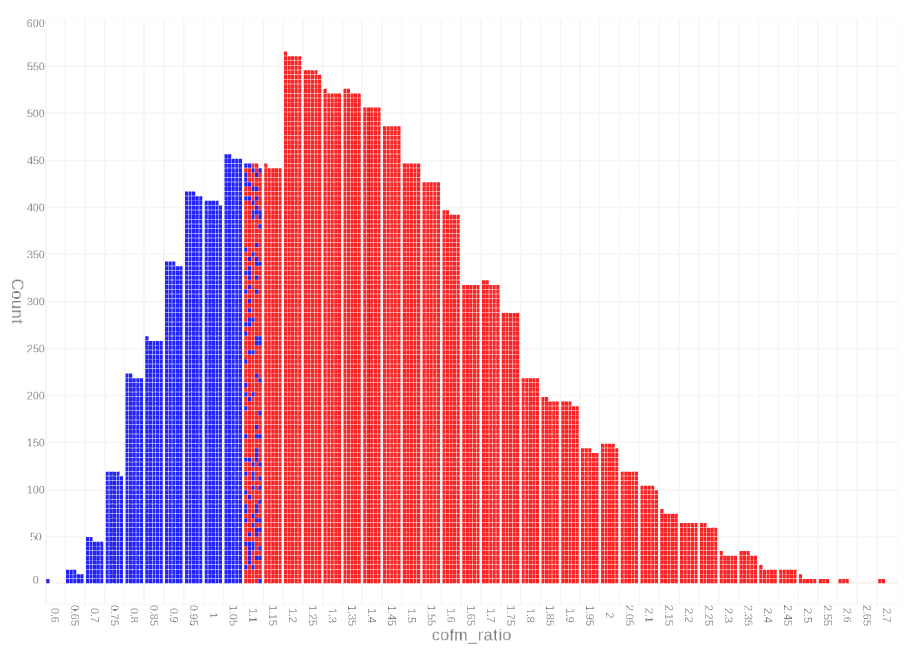
Following the execution of 10,000 Monte Carlo iterations, the simulation produced a definitive, data-driven conclusion: The PLAN/Iranian alliance achieved a COFM ratio greater than 1.1 in 7604 iterations, resulting in an 76.04% probability of operational success.
This high probability indicates that enforcing a kinetic blockade against this specific joint force is mathematically unfeasible for the current US order of battle. The sheer aggregate power of the Chinese defensive screen, combined with the offensive saturation capability of the Iranian coastline and the precision long-range strike capability of hypersonic missiles, consistently overwhelms the localized combat potential of the divided US fleet.
Analyzing the Fat Tails
While an ~76% success rate heavily favors the PLAN, analyzing the ~24% of iterations where the US successfully held the blockade provides critical operational intelligence. In these outlier events—the "Fat Tails" of the probability distribution—stochastic variables aligned to perfectly favor NAVCENT.
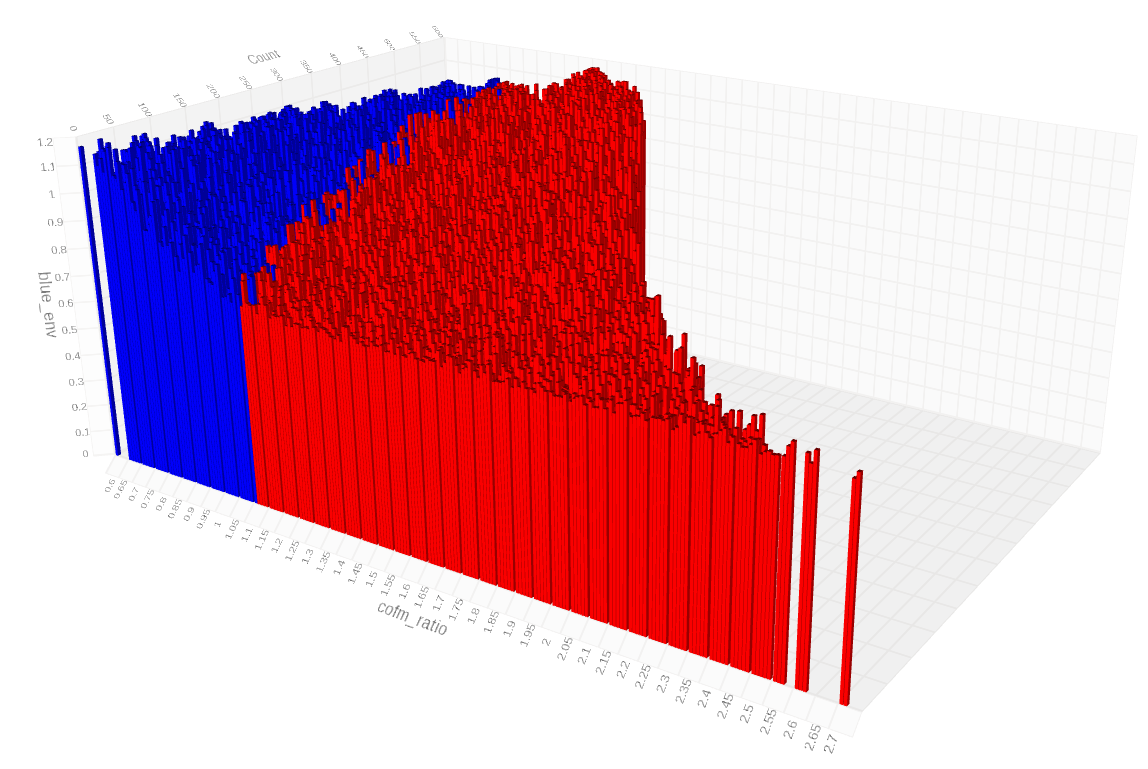
Simulation logs reveal that Blue Force victories occurred almost exclusively when the Blue Environmental Multiplier ($M$) approached its absolute maximum (1.2) while the Red Multiplier simultaneously bottomed out (0.8). Operationally, this represents a scenario where the US Carrier Air Wing's electronic attack platforms (such as EA-18G Growlers) achieve total dominance of the electromagnetic spectrum, blinding the Type 055's target acquisition radars and severing the data-links between Iranian shore batteries and PLAN vessels. If the Red force cannot complete the kill chain, their VLS numerical advantage is mathematically neutralized.
Environment Over Platform Quality
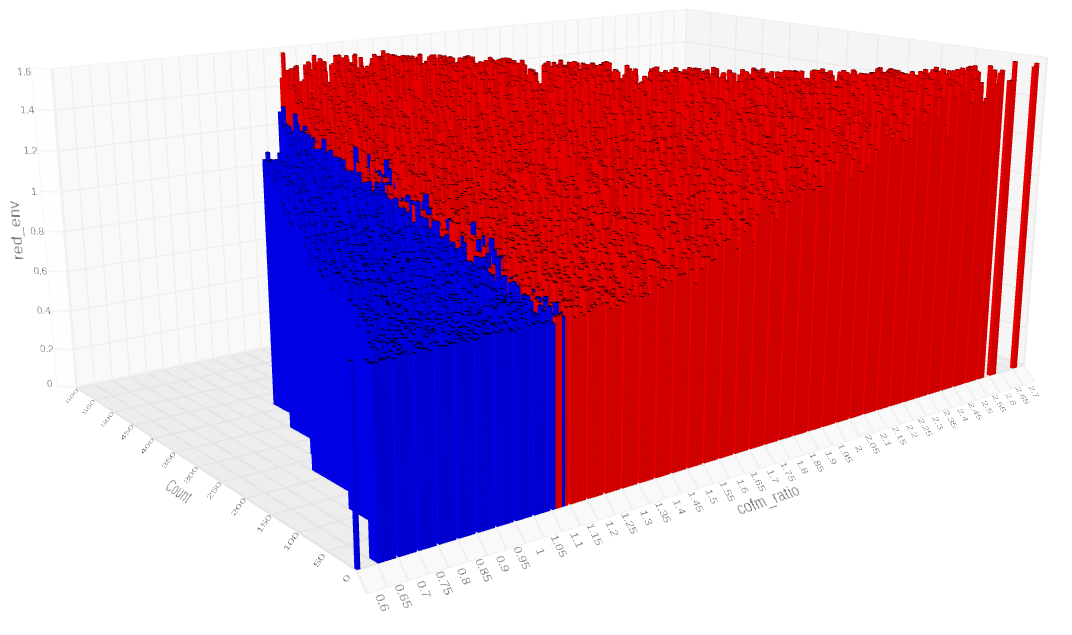
A profound takeaway from this iteration of the model is that the widened 15% epistemic uncertainty ($K$ variance) did not save the Blue Force. Even in loops where Chinese platform quality underperformed expectations and US platform quality overperformed, the PLAN still often secured the transit. The decisive variable was the environment ($M$). Geography and sensor fusion dictated the outcome, proving that in constricted littorals, the operational environment supersedes the engineering quality of the hull.
Strategic and Doctrinal Implications
The results of this stochastic analysis fundamentally challenge several legacy assumptions held by Western naval planners.
The Unsinkable Carrier and Littoral Compression
Since the mid-20th century, the US Carrier Strike Group has been viewed as an apex predator capable of establishing sea control by its mere presence. This simulation mathematically demonstrates that CSGs suffer acute vulnerabilities in constricted littoral environments. Carrier aviation relies on standoff distance to generate sorties, manage combat air patrols, and maintain a layered defense. When forced to operate within the Gulf of Oman—well within the engagement envelopes of both Iranian land-based ballistic missiles and PLAN ship-launched weapons—the carrier's survivability rapidly deteriorates. Furthermore, even if the carrier is not sunk, a missile impact on the flight deck still constitutes a mission kill.
The Power of Proximity as Mass
The PLAN's acknowledged weakness in global power projection is the logistical nightmare of operating thousands of miles from the Chinese mainland. However, this model illustrates how strategic alliances can offset this vulnerability. By partnering with Iran, the PLAN utilizes the Iranian landmass as a static, unsinkable aircraft carrier. Iran provides a sensor-rich environment and a magazine depth that the PLAN lacks in the Far Seas. The Chinese SAG can effectively ignore its northern flank, focusing its sensor arrays entirely on the US fleet. In this theater, geographic proximity acts as a substitute for mass.
Conclusion
The mathematics of blockade running in the missile age are unforgiving. This stochastic COFM simulation indicates that the United States cannot successfully blockade a determined PLAN Surface Action Group in the Strait of Hormuz given the current order of battle and active Iranian support. An 76.04% probability of PLAN success is not a reflection of superior Chinese seamanship but is the cold mathematical reality of geographic proximity and aggregated combat potential overcoming dispersed naval assets.
To alter this calculus, NAVCENT cannot simply rely on the myth of the qualitative superiority of the CSG. Breaking this statistical trend would require a fundamental shift in the baseline variables: either injecting significantly more mass into the theater (e.g., deploying a second CSG or integrating persistent B-21 Raider support) to alter the $W$ variable, or to suppress the Red force's $M$ multiplier using means, ranging from political-economic to military. As the era of uncontested American sea control wanes, defense planners must rely on statistical modelling and rigorous operations research to navigate a battlespace where sensors, algorithms, and geography dictate the victor.
Appendix
The software used during this experiment has been published on Github and is available for public use.


Comments ()